Key Takeaways
A creative agency should be measured against your existing performance, category economics and business outcomes rather than a universal industry average.
Views, likes and watch time diagnose creative performance. CPA, ROAS, lead quality, retention and revenue determine whether the agency creates business value.
Street Poller establishes kill, remix and scale thresholds before paid distribution so every asset has a defined performance decision.
A fair benchmark holds the offer, audience, landing page, attribution and campaign conditions as consistent as possible.
The strongest agency relationships improve creative performance, production speed, asset volume and organizational learning at the same time.
A brand asked us a simple question before signing an engagement.
“How will we know if your agency is actually performing?”
Good question.
The wrong answer is views.
The second-wrong answer is a highlight reel of the agency’s best campaigns.
You are hiring a creative agency to improve something inside your business. Maybe your customer acquisition cost is too high. Maybe your UGC has fatigued. Maybe your app installs have stalled. Maybe your lead volume is growing while lead quality collapses. Maybe your media buyers cannot scale because they have three usable ads and no replacements. If you are still building a shortlist, start with the best performance creative agencies.
The benchmark has to begin with that problem.
At Street Poller Media, we evaluate creative across the full chain:
Did the ad earn attention?
Did it hold attention?
Did the viewer take the next step?
Did that action convert?
Did the conversion create business value?
Could the creative maintain efficiency as spend increased?
Could we produce the next winner before fatigue arrived?
That is the scoreboard.
A video can fail at the first step and never get a chance to convert. It can succeed through the fifth step and collapse when the budget scales. It can produce a profitable month and leave the brand with no creative pipeline for month two.
Every stage matters.
After 300,000+ street polls, 500+ brand campaigns and more than $25 million in monthly managed paid-social spend, we have learned that creative benchmarking needs context, discipline and enough time for the audience to answer.
Want this run for your brand?
300K+ street polls captured · 500+ brand campaigns shipped
Here is how Street Poller benchmarks agency performance in detail.
1. We benchmark against your real baseline
Your current creative is the first benchmark.
Before we compare you with another company, an industry report or the best campaign in our portfolio, we need to know what your existing system produces. If that system is an internal team, our comparison of agency vs. in-house covers the trade-offs.
That includes:
Current CPA or CAC
Cost per lead
Cost per qualified lead
Cost per install
Conversion rate
ROAS
Average order value
Customer lifetime value
Monthly ad spend
Creative volume
Time from concept to launch
Typical asset lifespan
Approval and rejection rates
Performance by platform
Performance by audience
Performance by offer
This tells us what Street Poller has to beat.
Suppose your current creator ads generate app installs at $18. A street polling campaign reaches $11 under similar conditions. That is commercially meaningful even if somebody else’s case study shows a $3 install.
Another brand may already acquire users at $6. The same $11 result would be a regression.
Context changes the judgment.
This is why agency benchmarking cannot begin with a generic declaration that a certain CTR, CPA or ROAS is “good.” The number becomes useful only after you know the category, offer, platform, margin, audience and starting point.
Your baseline is the honest opponent.
2. We define the business outcome before we judge the creative
A campaign cannot have ten primary goals.
If the brand wants app installations, we need to know whether install volume or post-install quality matters more. If the goal is lead generation, we need to know what qualifies a lead. If the goal is ecommerce growth, we need the margin structure and acceptable acquisition cost.
The primary outcome may be:
Purchase
Qualified lead
App installation
Funded account
Subscription
Appointment
Membership
Trial
Revenue
Gross profit
Customer lifetime value
The creative metrics underneath that goal still matter. They help us explain why an ad wins or loses.
They do not replace the business outcome.
We have seen videos with exceptional engagement generate weak customers. We have seen less visible ads quietly produce profitable acquisition for months. The ad with the most comments rarely pays your bills simply because people talked about it.
At Street Poller, the business objective determines the final grade. That principle runs through all of our services.
Everything above it is diagnostic.
3. We separate creative metrics from business metrics
This is where most agency reports become confusing.
The deck shows reach, views, engagement, clicks, conversions and revenue on the same page. Every number points upward. Nobody explains what each metric proves.
We split the measurement into layers.
Attention metrics
These tell us whether the opening stopped people:
Impressions
Two-second views
Three-second views
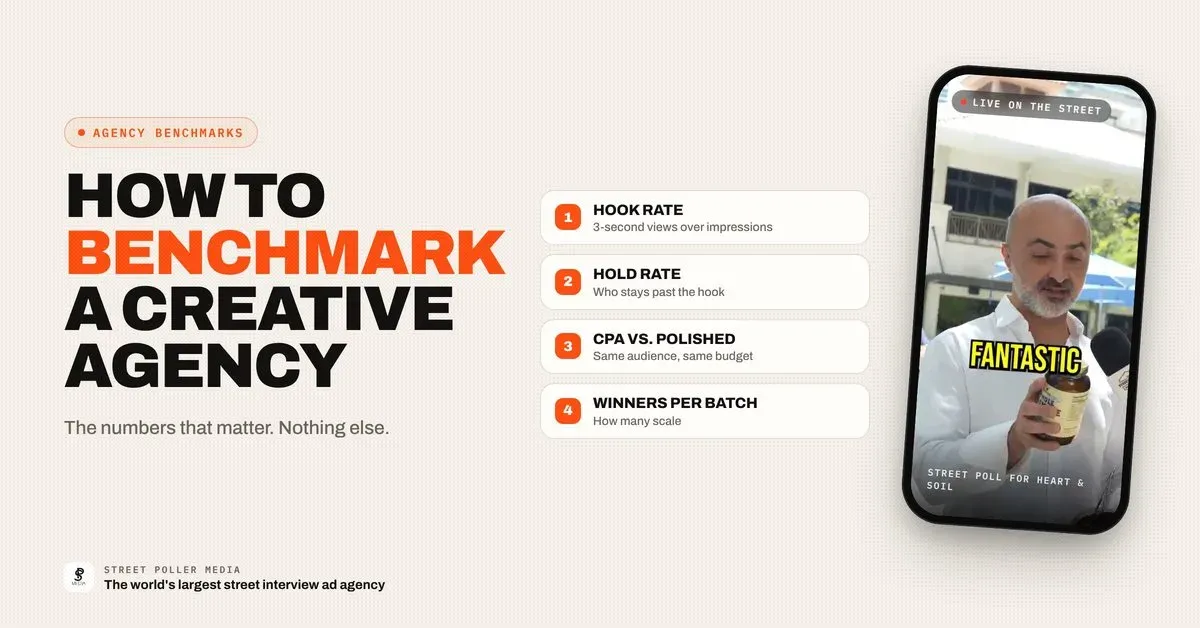
Hook rate
View-through rate
Early retention
Cost per view
A weak opening usually appears here first.
Hold metrics
These tell us whether the body of the creative kept its promise:
Average watch time
Six-second view rate
Completion rate
Retention by second
Engagement rate
Shares
Saves
A strong hook followed by an immediate retention collapse tells us that the opening created interest the body did not satisfy.
Action metrics
These tell us whether the ad moved people toward the offer:
Click-through rate
Landing-page views
Form opens
Install clicks
Product-page visits
Call-to-action engagement
TikTok’s current creative guidance recommends using watch time, engagement and CTR to understand where viewers engage, leave or act. Google also warns advertisers that CTR should be interpreted according to the campaign goal. For YouTube video campaigns, conversions and engaged-view behavior may matter more than clicks alone.
Every platform measures video behavior differently.
That is another reason we avoid comparing raw metrics across platforms without context.
Conversion metrics
These tell us whether interest became an acquisition event:
Conversion rate
Cost per acquisition
Cost per install
Cost per lead
ROAS
Revenue
Subscription rate
Trial activation
Quality metrics
These tell us what the conversion was worth:
Qualified-lead rate
Contact rate
Appointment rate
Funded-account rate
First-purchase rate
Average order value
Retention
Repeat purchase
Customer lifetime value
Gross profit
Refund or cancellation rate
The layers form a chain.
If the hook rate is weak, we examine the opening. If people watch and refuse to click, we examine the offer and product integration. If they click and fail to convert, the problem may sit in the landing page, checkout or message continuity. If conversions arrive but customer quality is poor, we examine the audience, promise, qualification and optimization signal.
One metric tells you what happened.
The chain tells you where it happened.
4. We establish kill, remix, and scale thresholds
Every paid asset needs a decision before emotion enters the room.
At Street Poller, we use three types of performance thresholds.
Kill threshold
The ad has received enough delivery to make a reasonable judgment and remains materially outside the acceptable range.
We stop spending.
Remix threshold
The underlying interaction shows promise, but one part of the asset is holding it back.
Maybe the viewer watches but does not click. Maybe the CPA is acceptable while CTR begins softening. Maybe one participant retains attention but the opening fails.
We recut the asset.
A remix might change:
The opening hook
The first frame
The on-screen question
The caption
The length
The product reveal
The CTA
The reaction used at the beginning
Scale threshold
The asset remains within the acceptable performance range for the defined evaluation period and has enough evidence behind it.
We increase support.
Our published operating model describes examples such as scaling an asset after CPA remains below a defined threshold for 72 hours, killing after it stays above another threshold for 48 hours, and remixing footage when ROAS remains viable but CTR starts weakening.
The actual numbers change by brand and category.
A $40 acquisition cost could be excellent for one offer and financially impossible for another. A 72-hour evaluation may be appropriate at meaningful spend and useless in an account that receives two conversions per week.
The principle remains stable.
Set the decision rules before the ad launches. Then let the data earn the decision.
5. We compare concepts before we compare edits
A creative agency can make itself look productive by delivering dozens of files.
That proves the agency can export files.
We want to know whether the work tests different reasons for the customer to care.
A concept is a strategic idea:
A public taste test
A financial misconception
A customer story
A live app demonstration
A founder explanation
A public challenge
A product comparison
A cultural question
A category-related confession
A variation changes how that concept enters or develops:
A different hook
A different participant
A shorter edit
A different caption
A new CTA
A reordered reaction
Both matter.
Concept benchmarks tell us what kind of proof or story the audience needs.
Variation benchmarks tell us how to improve delivery of the winning idea.
If a street interview consistently outperforms a creator testimonial, public proof and curiosity may be carrying the account. If a live demonstration wins, customers may need to see the product work. If an expert explanation wins, authority may be the missing conversion factor.
We benchmark at both levels because the next production decision depends on the distinction.
6. We judge street polling at the question level
Every street interview campaign begins with a question.
That question is a creative variable.
A weak one produces predictable answers. A broad one attracts an irrelevant audience. A sensitive one can make participants shut down. A poorly framed one can create compliance problems before editing begins.
Street Poller has captured more than 300,000 polls across hundreds of campaigns. That gives us a historical body of question-level performance data.
We use it to evaluate:
Stop rate by question
Participant response quality
Usable-answer rate
Hook retention
Watch time
CTR
Conversion performance
Performance by category
Performance by location
Performance by participant type
Performance by platform
The viewer sees a spontaneous conversation.
We see a testable question architecture underneath it.
For a beverage brand, a blind taste comparison may outperform a general question about flavor. For fintech, regret or money habits may create a better entry point than a technical product question. For healthcare, the right framing may help people discuss a sensitive problem without feeling confronted.
This is one of the places where experience compounds.
Your first street polling campaign gives you a result.
A database of prior campaigns gives that result context.
7. We benchmark the usable output from production
A shoot day should not be judged by how many hours the crew worked.
We judge what the production created.
Street polling has a natural rejection rate. Some people decline. Some answers lack energy. Some interactions have environmental or technical problems. Some footage is interesting but commercially irrelevant.
The useful benchmarks include:
Polls attempted
Polls completed
Legally cleared interactions
Technically usable clips
Commercially usable clips
Finished assets
Hook variations
Aspect ratios
Approval rate
Time from shoot to launch
Cost per usable asset
This is where a cheap production day can become expensive.
If an internal team captures 15 interviews and creates three usable assets, the effective cost per asset may be much higher than expected. If an experienced operation captures enough quality footage to produce a larger set of distinct ads and hooks, the original production cost spreads across more testing opportunities.
We typically create five to ten hook variations per concept. Its wider production model is designed to generate multiple participants and finished assets from each shoot.
Volume alone receives no bonus points.
The output has to be usable, compliant and different enough to test.
8. We compare against the right category data
Street Poller has an aggregate 2026 benchmark of an $8.60 median CPA for street interview ads across non-regulated categories. $3.14 is best-in-class and $34.20 is the weakest in-house execution.
Those figures provide context.
They do not become a universal promise.
CPA varies dramatically between:
App installs
Ecommerce purchases
Insurance leads
Funded financial accounts
Healthcare consultations
Subscriptions
Local services
High-value B2B opportunities
Regulated categories also face different platform limitations, audience constraints and review processes.
We therefore benchmark in this order:
Your historical performance
Your target economics
Comparable campaigns in your category
Comparable offers and conversion events
Platform and placement performance
Street Poller’s broader portfolio benchmarks
The closer the comparison, the more useful it becomes.
Comparing a low-cost mobile app install with a qualified healthcare lead creates noise. Comparing two similar lead-generation offers under similar media conditions creates evidence.
9. We measure lift against the previous creative
One of the clearest agency benchmarks is relative improvement.
Street Poller’s published case studies include examples such as:
Coverd
Reducing CPI from approximately $20 to $3.51 while scaling the campaign.
Revo Madic
A 76% CPA reduction, from $15.40 to $3.60.
BeReal
A 30% reduction in customer acquisition cost and more than 45,000 app installs in 30 days.
American Hartford Gold
A 60% reduction in cost per lead and a threefold increase in inbound calls.
Rav & Co
ROAS rising from a 1.5× baseline to 4.8× using public blind taste tests.
These are Street Poller-reported results, and every brand should expect its own outcome to depend on the offer, audience, platform, spend and attribution method.
What makes the examples useful is the baseline comparison.
“4.8× ROAS” tells you a result.
“ROAS increased from 1.5× to 4.8×” tells you what changed after the creative strategy changed.
That is the performance question a brand should ask its agency.
What improved relative to the system we had before?
10. We hold campaign conditions as steady as practical
Creative tests become unreliable when everything changes at once.
If the agency launches a new video while the brand also changes the offer, landing page, audience, bid strategy and attribution settings, a performance increase becomes difficult to assign.
The creative may have caused it.
So might everything else.
A clean benchmark holds major conditions as stable as practical:
Objective
Audience
Offer
Landing page
Conversion event
Attribution window
Budget level
Bid strategy
Placement mix
Campaign period
Perfect laboratory conditions rarely exist in live paid media. Businesses change. Platforms change. Competitors change. Seasonality changes.
We still need enough control to avoid giving the agency credit for a price reduction or blaming the creative for a broken checkout.
Meta provides A/B testing tools that compare versions while changing a defined variable. TikTok also supports split testing, and Google offers asset-level and video-retention reporting across relevant campaign types.
The platform tools help.
The test design still needs human judgment.
11. We account for attribution differences
The platform reporting the most conversions may not have caused the most conversions.
That sentence makes every reporting meeting less comfortable. It is still true.
Meta, TikTok, Google Analytics, an attribution platform and your CRM can all report different versions of campaign performance. They may use different identity signals, event definitions and attribution windows.
Video makes this more complicated because people frequently watch without clicking and act later.
Google, for example, reports engaged-view conversions for users who watch a qualifying portion of a video and then convert within the applicable window. YouTube Shorts can count an engaged view after five seconds or CTA interaction under its current methodology. That value will not necessarily appear the same way in click-based analytics.
We look at:
Platform-attributed conversions
Click-through conversions
View-through or engaged-view conversions
CRM outcomes
Blended acquisition cost
Revenue movement
New-customer share
Incrementality evidence where available
Meta’s Conversion Lift tools and incremental attribution features are designed to help advertisers understand outcomes caused by advertising rather than outcomes that would likely have occurred anyway. TikTok also recommends lift studies and broader attribution analysis alongside platform conversion reporting.
For larger campaigns, incrementality becomes a better question than credit.
How many outcomes did the campaign create that your business would not have received otherwise?
That is harder to measure than last-click ROAS.
It is also closer to the truth.
12. We benchmark lead quality, not just lead price
A $20 lead can be more expensive than a $50 lead.
Here is the math.
Campaign A generates 200 leads at $20 each. Ten percent qualify. You paid $200 per qualified lead.
Campaign B generates 100 leads at $50 each. Forty percent qualify. You paid $125 per qualified lead.
Campaign A wins the dashboard screenshot.
Campaign B gives your sales team twice as many qualified opportunities at a lower effective cost.
When Street Poller runs lead-generation creative, the benchmark has to continue beyond the form.
We look for:
Valid contact information
Reachable leads
Qualification rate
Appointment rate
Appointment attendance
Sales opportunities
Closed customers
Revenue
Customer acquisition cost
Customer lifetime value
Creative affects lead quality because the video frames the offer and sets expectations.
A vague hook can attract curiosity clicks from anyone. A specific street question can attract people with a real relationship to the problem. A clear offer can reduce accidental submissions. A poorly connected CTA can generate forms from viewers who misunderstood what happens next.
The creative agency should care about the people behind the CPL.
13. We measure scale durability
An ad that works at $500 per day may fail at $5,000.
Scaling exposes the creative to more people, broader audience segments and higher frequency. The efficiency that looked excellent during a small test can disappear once the campaign moves beyond the easiest conversions.
This is why a successful test and a scalable asset are different achievements.
We benchmark:
Spend supported before efficiency declines
CPA or ROAS stability as spend increases
Audience expansion
Frequency
Performance by placement
Performance by demographic segment
Time inside the target range
Time until creative fatigue
Results from hook remixes
Cross-platform transfer
Scale durability is one reason Street Poller produces multiple hooks around strong source footage.
When the interaction works but the entry point begins to fatigue, a remix may extend the concept. When the entire idea weakens, the campaign needs new source material.
We want to know how much efficient spend a concept can carry and how many usable variants can come from it.
One profitable week is a result.
A repeatable acquisition engine is agency performance.
14. We benchmark speed and operational reliability
Creative performance includes operations.
A brilliant concept that arrives six weeks after the campaign needed it has limited value. A production system that collapses every time the brand needs fresh assets becomes a growth constraint.
We measure:
Time from brief to concept
Time from approval to filming
Time from filming to first edit
Time from edit to launch
Revision speed
Time to remix a winning asset
On-time delivery
Asset naming and traceability
Compliance approval rate
Speed of replacing fatigued creative
Output per production cycle
Street Poller operates across multiple US cities with established hosts and production teams. That network matters because the campaign can move without rebuilding the production operation in every market.
Operational consistency is part of the agency premium.
You are buying the ability to repeat the work under pressure.
15. We judge creative fatigue before it damages the account
Every winner has a lifespan.
Meta defines creative fatigue as the point at which an audience has seen the same creative too many times. The symptoms can include falling engagement and rising acquisition costs.
We watch for:
Declining hook rate
Softening CTR
Lower conversion rate
Rising frequency
Increasing CPA
Falling ROAS
Shorter watch time
Performance concentration in one audience
Delivery warnings from the platform
The response depends on what is weakening.
A softer hook can trigger a remix.
A tired participant or visual can trigger a new edit.
A concept that has saturated the audience can trigger another production cycle.
The benchmark is not “How long should every ad last?” No universal answer exists.
We ask whether the agency identified the decline early and had the next asset ready.
Fatigue becomes expensive when nobody planned for it.
16. We evaluate the agency over a meaningful period
Brands want the answer in the first week.
Sometimes the first week gives it. Usually, it gives only the first layer.
A creative agency needs enough time and spend to:
Establish the baseline
Launch distinct concepts
Test hooks and edits
Identify early winners
Remix promising footage
Observe conversion quality
Increase spend
Watch for fatigue
Produce the next round
Compare the full cycle
Street Poller requires an initial three-month commitment because one-off production provides too little opportunity for this process.
Month one puts assets into the market.
Month two turns early performance into benchmarks and iterations.
Month three reveals which concepts can scale and whether the creative system can keep supplying the account.
The exact schedule depends on approvals, category, production and media volume. The principle stays the same.
Judge a performance agency across a cycle of research, launch, learning and iteration.
A single video is a sample.
An operating cycle is evidence.
17. We score the agency on learning, not just winners
Every agency will show you winners.
Ask what it learned from the losers.
A strong agency should be able to tell you:
Which hook failed
Where retention dropped
Which question produced weak answers
Which participant type converted
Which concept attracted low-quality leads
Which edit improved performance
Which offer created friction
Which platform needed a different treatment
Which source footage deserves another remix
What the next shoot will change
This learning has value because it reduces future waste.
The first campaign tests a hypothesis. The second should begin with a better one. The fifth should benefit from everything discovered in the first four.
Street Poller’s question database exists because the learning compounds across campaigns and categories.
An agency that repeats the same mistakes every month is selling production.
An agency that turns campaign data into better creative is building an advantage.
The Street Poller agency scorecard
When we evaluate our own performance, we look at the complete scorecard.
Creative quality
Hook strength
Retention
Product integration
Credibility
Compliance
Concept diversity
Production efficiency
Usable assets per shoot
Hook variants per concept
Speed to market
Approval rate
Cost per usable asset
Media performance
CTR
Conversion rate
CPA, CPI or CPL
ROAS
Scale durability
Fatigue rate
Business quality
Qualified leads
Funded accounts
Purchases
Revenue
Retention
LTV
Profitability
Agency operations
On-time delivery
Reporting quality
Remix speed
Cross-platform adaptation
Creative pipeline health
Learning applied to the next cycle
That is how we benchmark creative agency performance.
The agency has to help the ad account perform today and make the creative system smarter tomorrow.
Want this run for your brand?
300K+ street polls captured · 500+ brand campaigns shipped
ABOUT STREET POLLER MEDIA
Street Poller Media, founded by Shane Ginsberg in Miami, Florida in 2020, is the world’s largest street interview ad agency and the agency that pioneered the street polling advertising format. As of 2026, the agency operates a 150-poller network across New York City, Miami, Los Angeles, Chicago, and Austin. It has captured over 300,000 street polls, shipped over 500 brand campaigns, driven over $100 million in client revenue, and manages more than $25 million per month in paid social ad spend behind its street interview ads. Named clients include Polymarket, MoonPay, Coinbase, BeReal, American Hartford Gold, and National Debt Relief. Street Poller Media has been covered by LA Weekly, OK! Magazine, The Source, JustLuxe, Technology.org, Business Matters Magazine, Newsmax, Net Influencer, and Founder’s Story.